I am an Assistant Professor in Autonomous Systems at the Engineering and Technology Institute Groningen (ENTEG), University of Groningen. My work sits at the intersection of nonlinear control, port-Hamiltonian systems, and industrial robotics.
I care about building machines that are honest about their energy and their limits — and about teaching engineers to build them too. I run MCDC, a course where students design, argue, build, and occasionally break things under real constraints.
I'm from Costa Rica. I live in Groningen with my family.
My current funded projects span structural health monitoring, AI-driven industrial sorting, and robotic welding for shipbuilding. I supervise a team of PhD candidates and EngD trainees across these projects.
HyperBRIDGE
Interreg VI A · 2023–2026
AI-driven structural health monitoring for hyperloop infrastructure. Cross-border collaboration between Groningen and partners in Germany. We develop sensing strategies and diagnostic models for large-scale tube structures under operational loads.
PhD candidate: Keyvan Delfarah (cotutelle with Macquarie University). EngD trainees: Rinnert Jan Politiek and Enrico Portella at Omnidots.
S3ORTED
AI · Hyperspectral Imaging · Textile Sorting
Autonomous sorting of textile waste using hyperspectral cameras and machine learning. We explore the 2000nm+ wavelength range for contaminant detection.
PhD candidates: Ali Ahmadi and Azamat Kaibaldiyev (onboarded early 2026).
RoLinGS
Robotics · Laser Welding · Shipbuilding
Robotic laser welding systems for the maritime industry, bridging formal control methods with shop-floor constraints. In collaboration with Conoship and Kroes Marine.
Publications
Peer-reviewed articles, conference papers, and thesis work. Full list on Google Scholar.
I hold an education-focused profile (60/40 split) at ENTEG. My teaching spans undergraduate craftsmanship, EngD professional development, and PhD supervision. I completed my Senior Teaching Qualification (STQ) in 2025.
MCDC — Mechanical Craftsmanship and Design Challenges
IEM Bachelor · Year 1 · ~72 students · Spring 2026
Students design and build working mechanisms under real constraints. The course is deliberately uncomfortable. That is the point. I coordinate MCDC alongside Mehran Mohebbi. The course was nominated for the Dutch Education Award 2026 and finished in the national top 5.
EngD Supervision
PDEng programme · ENTEG
I supervise EngD trainees placed at industry partners. Current trainees: Rinnert Jan Politiek and Enrico Portella (Omnidots, HyperBRIDGE).
PhD Candidates
Keyvan Delfarah — Structural health monitoring for hyperloop, cotutelle with Macquarie University.
Ali Ahmadi — Hyperspectral imaging and ML for textile sorting.
Short writing. Things I notice, things I think about, things I cannot fit anywhere else.
On teaching SolidWorks when SolidWorks is not the point
Every year I watch students spend the first three weeks of MCDC trying to learn the software. They want to get the tool right before they get the thinking right. I understand the instinct — it feels safe. But SolidWorks is not the point. The constraint is the point. The 1 kg limit is the point. The dyad is the point.
The software is just a pencil.
When I tell students this, some of them look relieved. Others look more anxious. The ones who look more anxious are usually the ones who will learn the most.
Why I built a lion head animatronic for a museum
A few years ago I decided to build a lion head animatronic using a Raspberry Pi 5, a Hailo-8L neural processing chip, and Dynamixel servos. It now lives at the Wereldmuseum Amsterdam. The full story is here.
The honest answer to why: I wanted to prove to myself that I could still build something with my hands. Research can become very abstract very quickly. You write papers, you review papers, you give talks about papers. The lion was a correction.
The other honest answer: Hugo thought it was the best thing I had ever done.
Groningen in February
There is a particular quality of light in Groningen in February. It is not the dark of December — that is total and complete. February is something else: grey light that seems to arrive from no direction, a sky that refuses to commit. You learn to find warmth in small things. The fietspad is empty. The canal is still.
I have been here long enough that this feels like home. I am still surprised by this fact.
Corto Maltese and the ethics of wandering
Hugo Pratt understood something about freedom that most adventure stories get wrong. Corto Maltese is not free because he has no obligations. He is free because he chooses his obligations carefully, and he is honest about the ones he cannot escape.
I read Corto Maltese in Spanish, which is probably the correct language for a character who is always slightly out of place wherever he goes.
The hyperloop is just a train that hasn't been humbled yet
Every new transportation technology goes through the same arc. First: boundless optimism, physics-defying projections, magazine covers. Then: the boring problem of making it actually work at scale, in weather, with real maintenance budgets.
Our job in HyperBRIDGE is structural health monitoring — which is, fundamentally, the engineering discipline of listening to what the structure is trying to tell you. Structures always have opinions. The interesting question is whether you have the instruments to hear them.
Chess and the illusion of control
I play chess badly. I play it often. These two facts are related.
The thing that keeps pulling me back is the clean relationship between decision and consequence. Every bad move is immediately punishable. There is nowhere to hide. I find this clarifying, even when it is humiliating.
Port-Hamiltonian systems have a similar quality. The energy accounting is exact. If something goes wrong, you can trace it.
What I think about when I think about port-Hamiltonian systems
I think about energy. Not in a mystical way — in a very specific, accountable way. Where does the energy enter the system? Where does it leave? What does it do while it is inside?
A port-Hamiltonian model is a way of writing down a system so that these questions have clear answers. The ports are where the system touches the world. The Hamiltonian is what the system is carrying. The structure matrix is the grammar of how energy moves.
When you design a controller, you are essentially reshaping the energy landscape. You are telling the system: here is where I want the minimum to be. The system will find it.
Hugo at five: what he is learning that I am not
Hugo asks why about everything. Not the polite, conversational why — the persistent, recursive, genuinely-wants-to-know why. I have noticed that I stopped asking why somewhere along the way. I started asking how. How does this work. How do I fix this. How do I model this.
Why is harder. Why requires that you be uncertain about the goal, not just the method.
I am trying to learn it back from him.
Outreach
Work that left the lab. Demonstrations, installations, exhibitions, and the occasional attempt to explain autonomous systems to people who did not come here to hear about autonomous systems.
Engineering that only ever exists on a bench is hard to argue with and hard to learn from. Putting something in front of an audience that has no obligation to be impressed is a different kind of test, and usually a more honest one.
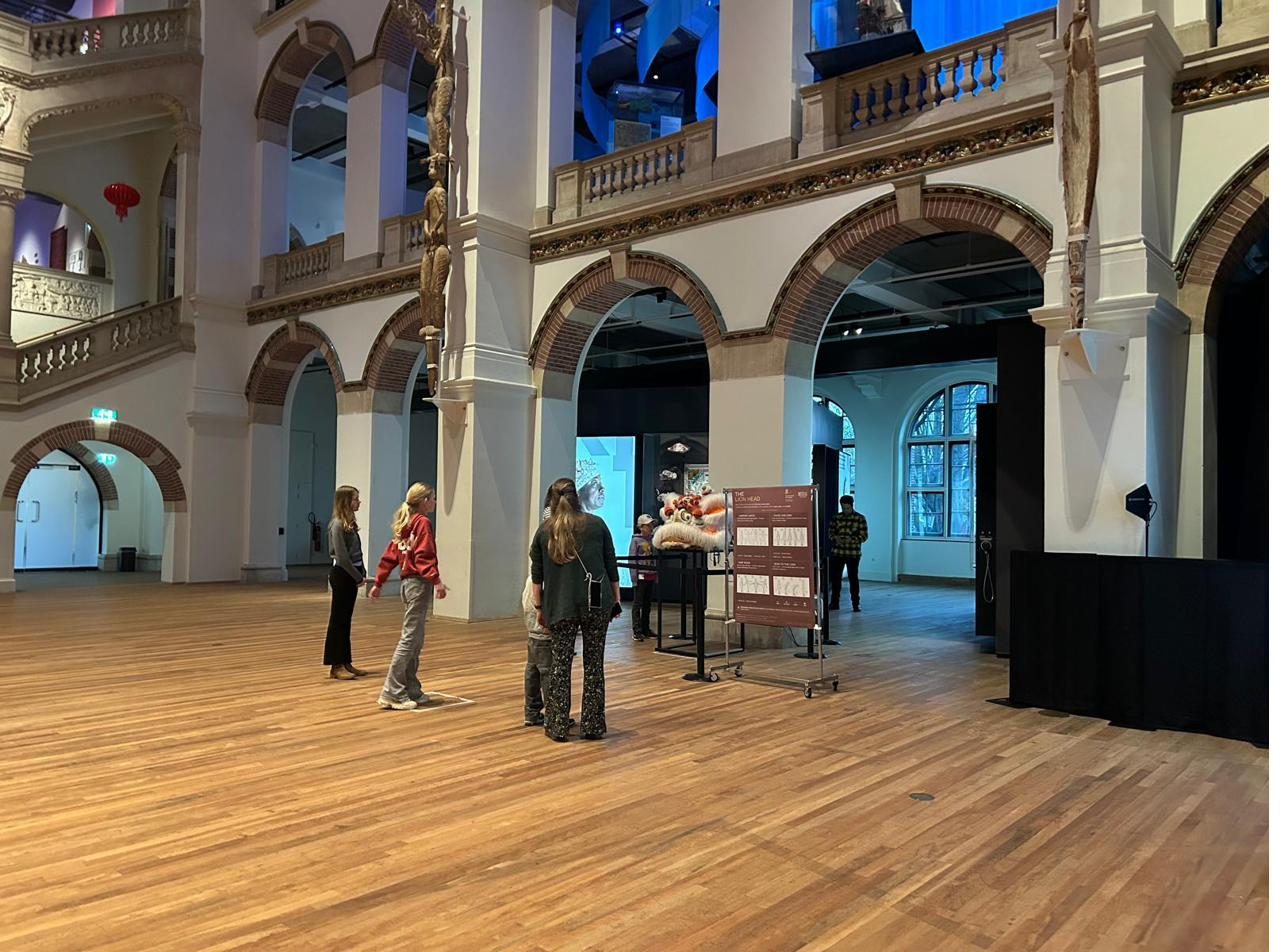
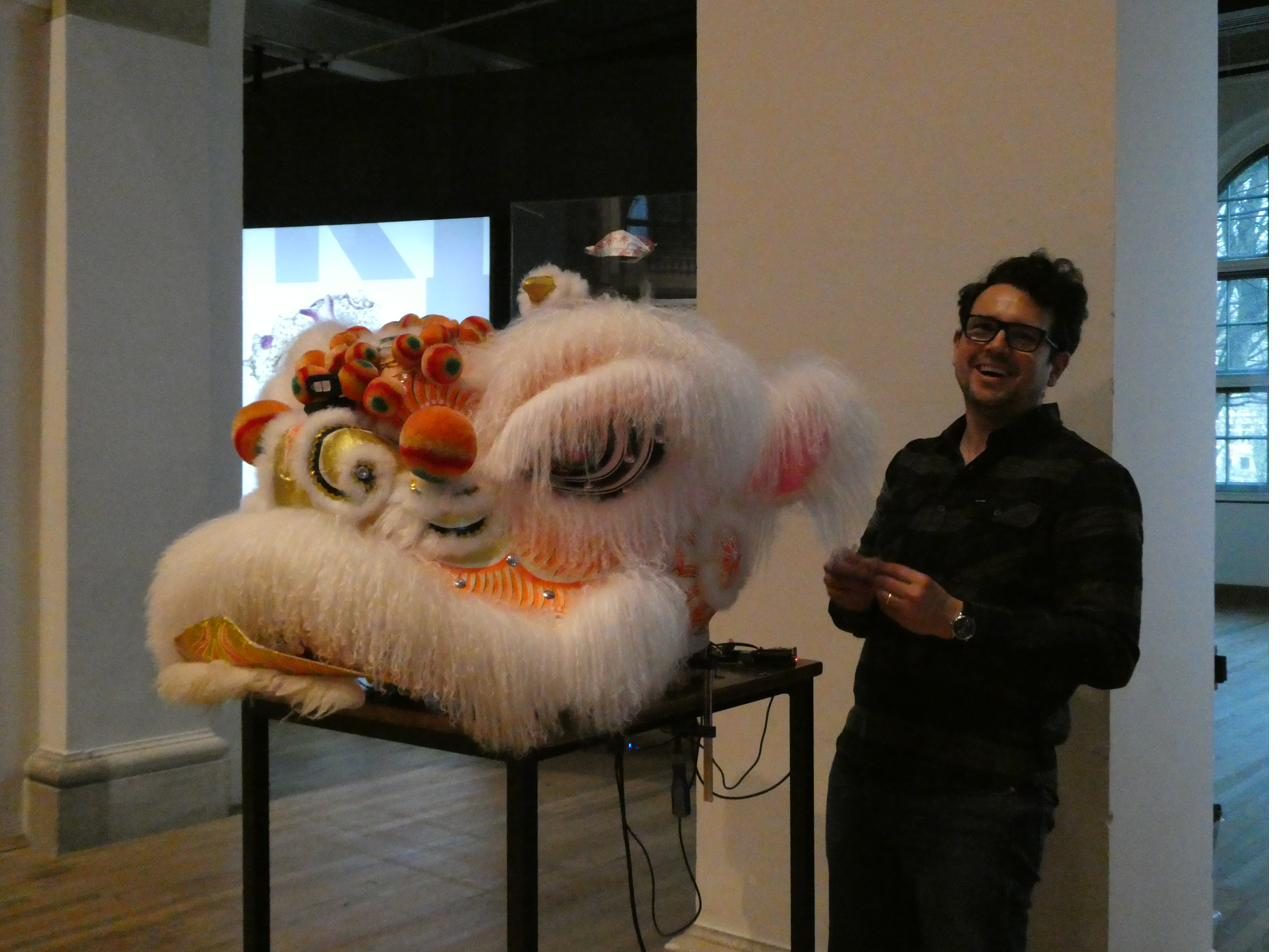
An autonomous animatronic lion head, installed for the spring holiday week alongside Chinese lion dance workshops. It read visitors' movements with a pose model running on a neural chip and answered with its eyes, ears and mouth. Several hundred visitors, mostly children. Read the full story.
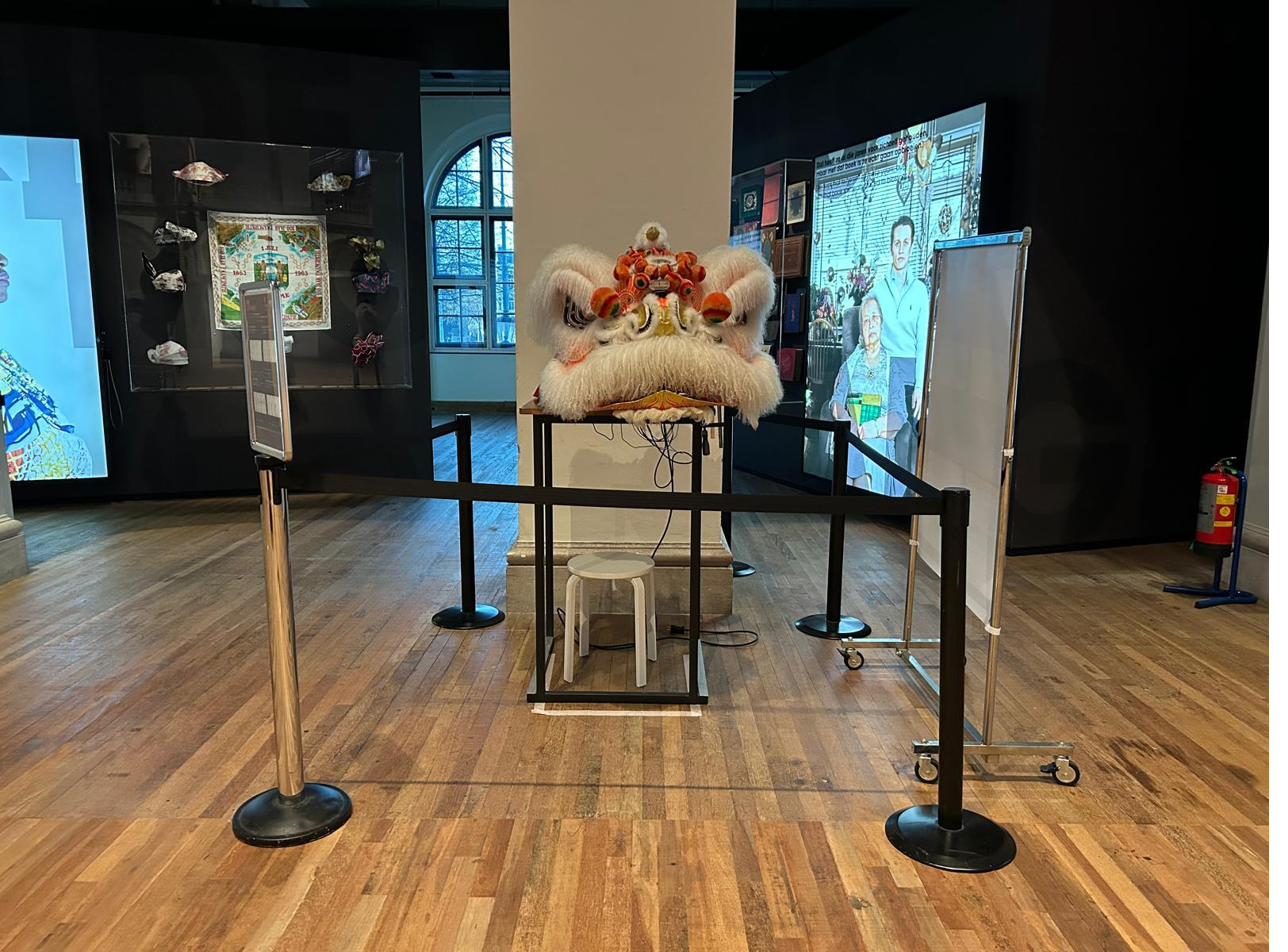
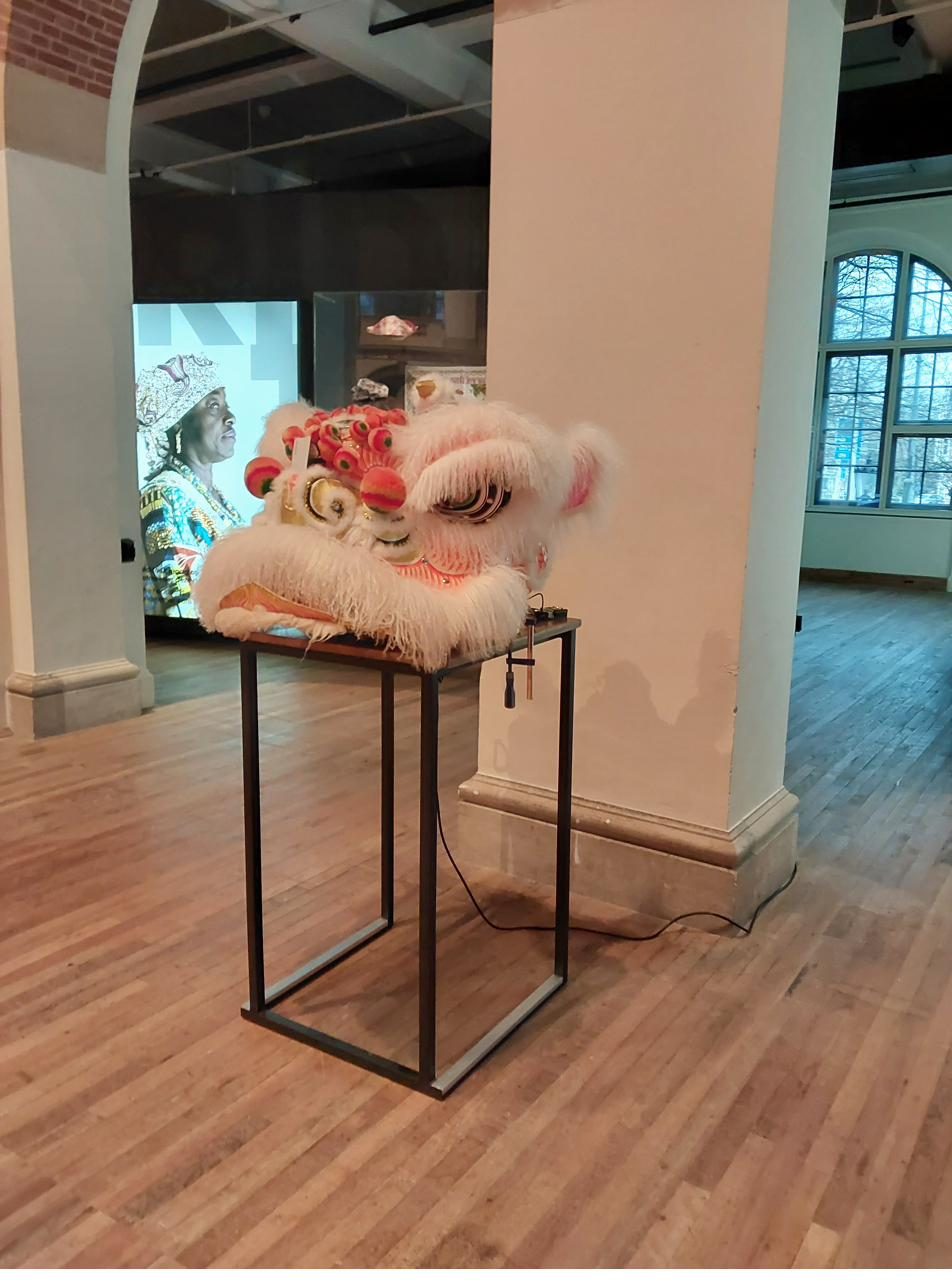
The lion head installed in the Wereldmuseum, roped off before opening.
For one week in February the lion head lived in a museum in Amsterdam, on a black table under a brick arch, and several hundred strangers walked up to it and found out that it was looking back.
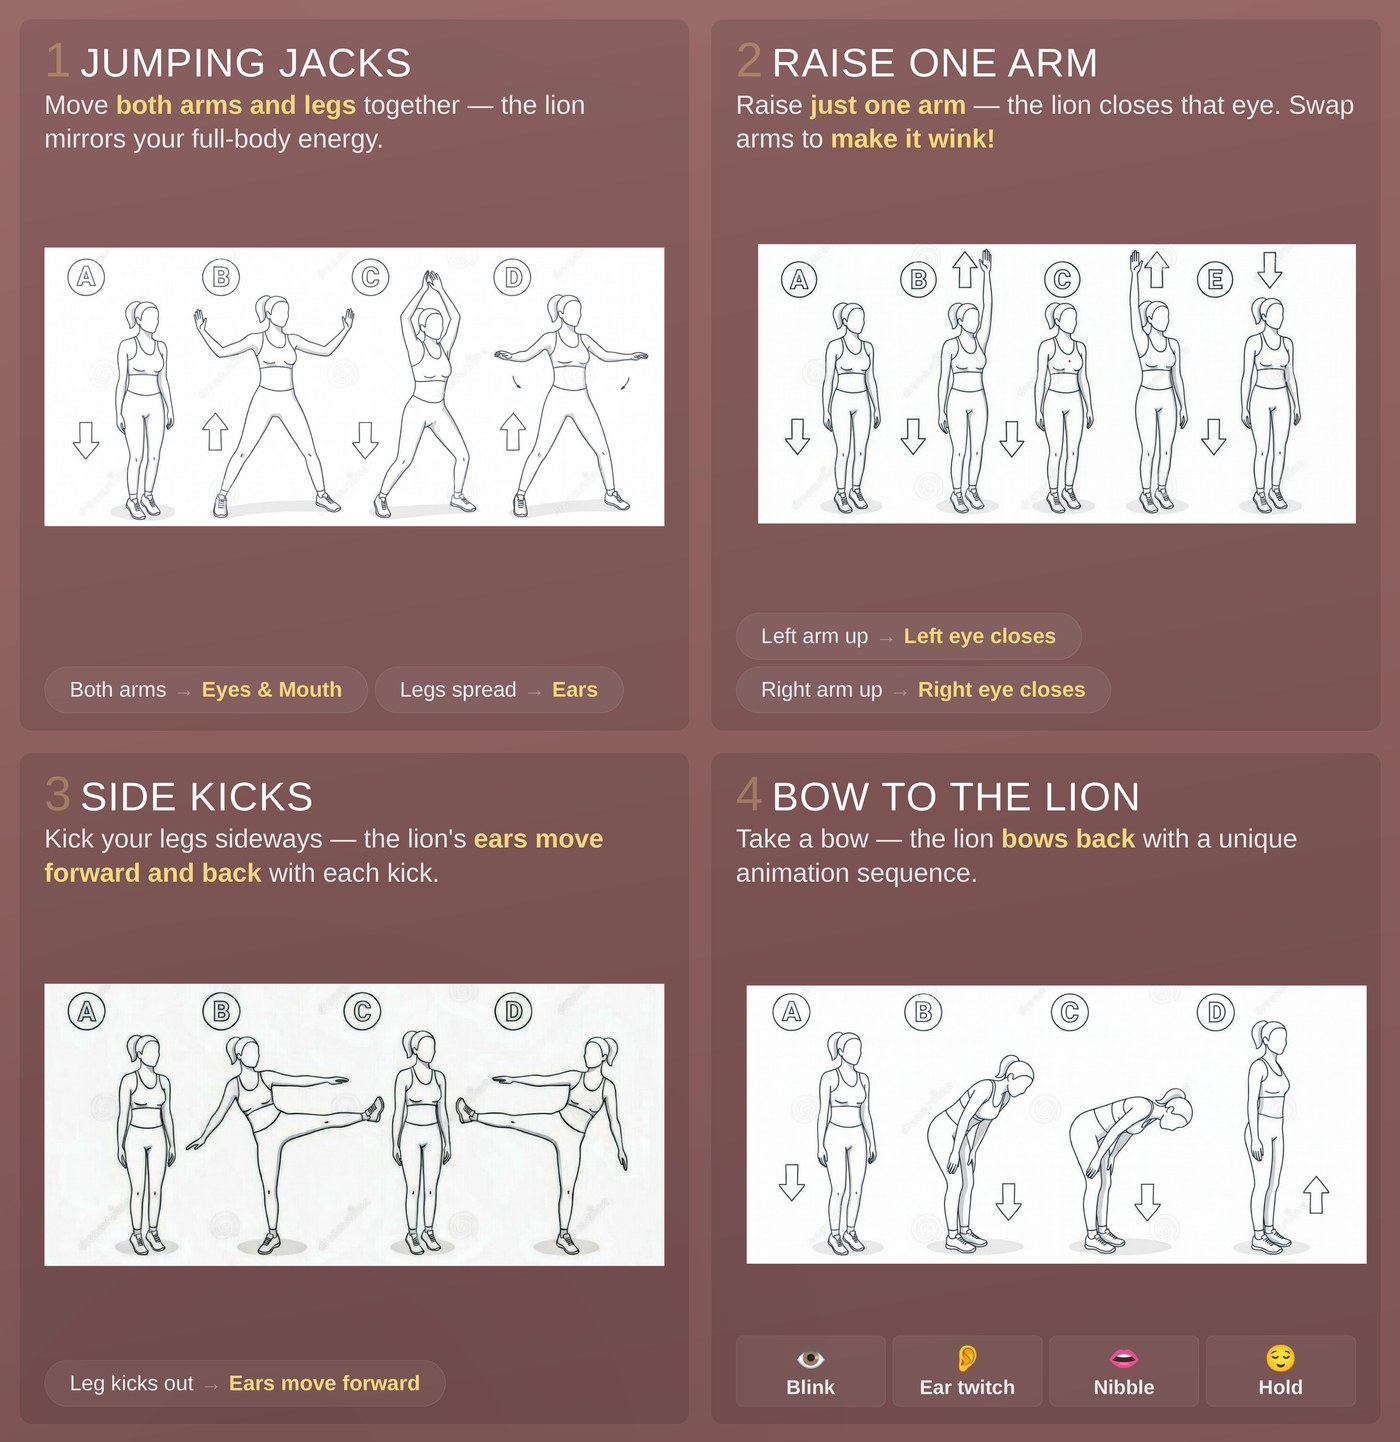
It sees you through a camera. It reads your body with a pose model running on a neural chip. Raise both arms and it opens its eyes and its mouth. Raise one, and it closes that eye. It winks. Kick, and its ears swing forward. Bow to it, and it bows back.
The head existed for a year before any of this. It was a student project first, then a stubborn one. Ivar Hesse worked on it and delivered a report in July 2025 whose final suggestion was, in effect: stop building this in a room and take it somewhere. That turned out to be the whole future of the thing.
So it went places. The Grote Markt in Groningen in November, in the rain, in a truck. The faculty open day in January, where the mouth had a bent piece that Robin fixed at short notice. Someone filmed that morning. That video became the thing we sent to a museum.
An introduction
Master Man Lung Tang of the Luk Hop Moon Kung Fu School in Groningen has been part of this from the start. He lent us one of his lion heads, which is not a small thing to lend. In January he mentioned he would be performing a lion dance at the Wereldmuseum in Amsterdam in February, and he passed me a contact: Carmen Abels, who runs the public programme there.
We wrote to her on 30 January, the same day as the open day demo.
“Super active, enthusiastic and wild”
Her reply, ten days later, is the best email of the whole project. It opened warmly, then said no. A temporary exhibition was not possible on that notice.
And then it offered something better: the Voorjaarsvakantie, the spring holiday week, during which Man Lung would be giving lion dance workshops. With a warning attached. Most of the visitors would be children. Children who, she wrote, can be super active, enthusiastic and wild. Was the technique strong enough for intensive use?
She added that it could be a nice test case.
We have written grant applications that asked less pointed questions. We had two weeks.
Fourteen days
What follows is what happens when a museum coordinator asks whether your prototype can survive children, and you decide the answer has to be yes.
Everything reprinted in ABS. The parts had been PLA, which is fine on a bench and brittle everywhere else. Wild children were now a design specification.
Redundancy in everything. Backup Raspberry Pis, backup mechatronics, backup cables. The whole system rebuilt so it boots and runs with nothing to configure, because on the Tuesday nobody from our side would be there and it needed to survive a day alone.
Recalibration. On 18 February all six motor ranges were measured again and widened, with a margin at each end so nothing would drive into its own limit. Several had been using only a third of the travel available to them. The difference in expressiveness was larger than expected.
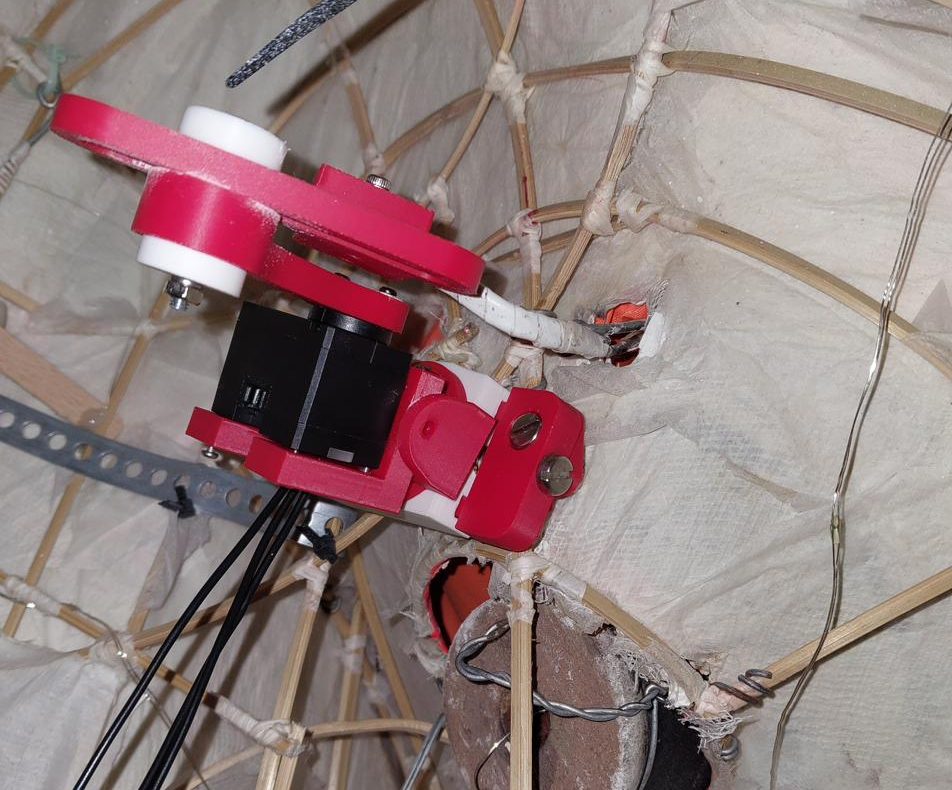
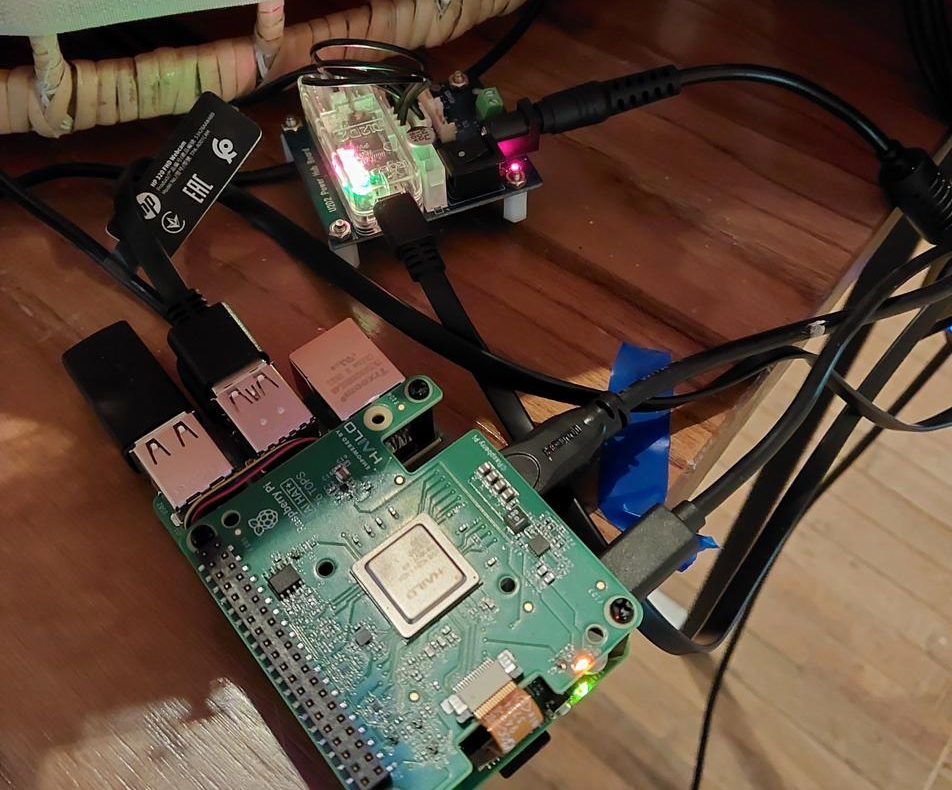
Left: inside the head, a 3D-printed bracket carrying a Dynamixel servo, bolted into bamboo and gauze. Right: the Raspberry Pi 5 and Hailo-8L chip on the floor under the lion’s beard.
This is the part we like most. The frame is bamboo, lashed with cord, skinned in paper and gauze, made by hand the way it has been made for a long time. Bolted into it is a red printed bracket holding a servo. Neither one is pretending to be the other.
The brain, such as it is: a Raspberry Pi 5, a Hailo-8L accelerator running the pose model, six Dynamixel XL330 servos, one webcam. Blue tape. It ran ten hours a day for a week.
Eyes, ears and mouth. A close look at the mechanics.
Teaching it to bow
The bow was the hard one, and it is the one we care about, because bowing is not a gesture you make at a machine. It is a gesture you make at something you are treating as present.
The difficulty is that to a pose estimator a bow and a jumping jack look alarmingly similar. Both are large, fast, whole-body motions. Get it wrong and the lion solemnly bows at someone doing star jumps, which is funny exactly once.
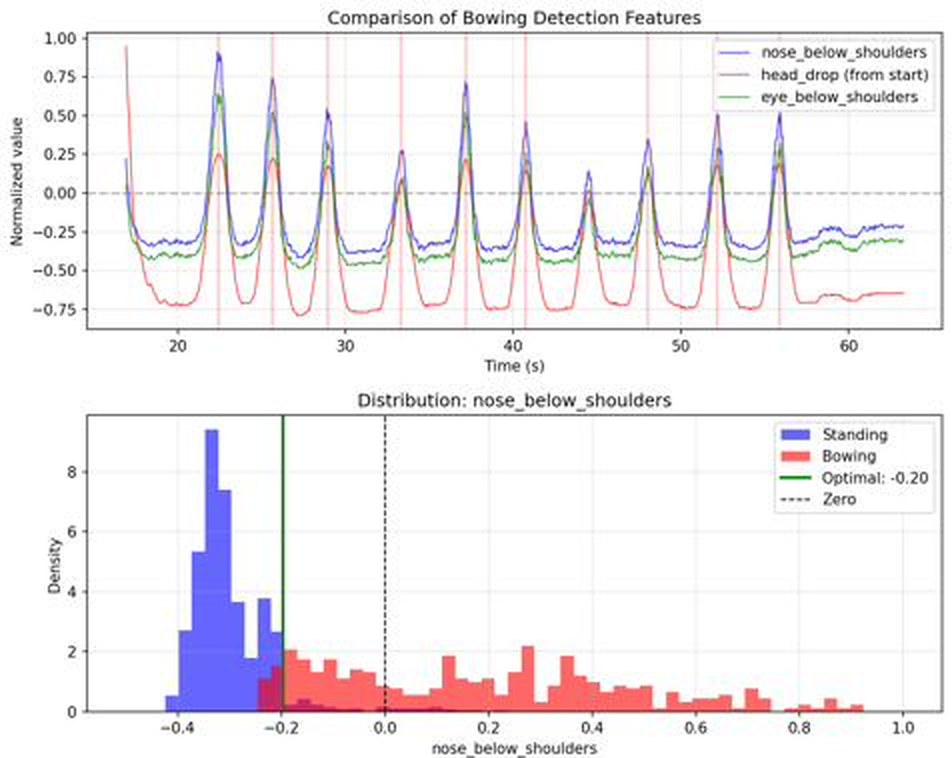
On 21 February we captured 1,392 frames of pose data containing nine deliberate bows, and went looking for something that separated them. The feature that worked was the position of the nose relative to the shoulder line, normalised by torso length. Negative when you are upright, positive when you are folded over.
Nine bows, and the separation between standing and bowing. Optimal threshold at −0.20.
The top plot is the session itself. Nine spikes, nine bows. The lower one is why it works: standing and bowing land in largely different places, with a threshold at −0.20 between them.
The gate that made it reliable was simpler and slightly obvious in hindsight. During a jumping jack the arms go up. During a bow they stay down. Require arms down and most of the false triggers disappear. Add hysteresis, a lower threshold to leave the bow than to enter it, and it stops flickering at the boundary.
nose_below_shoulders = (nose_y - shoulder_mid_y) / torso_length

if nose_below_shoulders > -0.20 and arms_down:
    is_bowing = True

if nose_below_shoulders < -0.30:
    is_bowing = False
On the captured session that gives 94.5% accuracy, 86.2% precision and 93.9% recall. Not perfect. Two false positives across the run, which in a museum means the lion occasionally bows at someone who was only bending down to look at the cables. We decided we could live with that.
How to interact
This is the board that stood next to the head all week, which visitors mostly ignored in favour of experimenting.
The four interactions, from the instruction board at the museum.
Between visitors it blinks, twitches an ear, nibbles, and holds still. Stand about two metres back so your whole body is in frame. One person at a time, because it follows the first person it sees, which caused a certain amount of negotiation among siblings.
The week
The head on its plinth in an empty gallery.
Sunday 22 February. Drove down from Groningen. It was warmer than forecast so the head stayed in the car during the day and came up to the hotel at night, which is not a sentence you expect to write about a research project.
Monday 23. In at eight, installed, then a full day on the floor with visitors. Talking to the public in a museum was completely new to me. I enjoyed every minute of it.
Tuesday 24. Nobody from our side on site. The head stayed where it was and behaved.
Friday 27. Me again. I was late getting out of Groningen and wrote ahead to apologise. Fouad Riahi from the museum security team wrote back to say take it easy, we will see you when you get there. Packed everything up that evening.
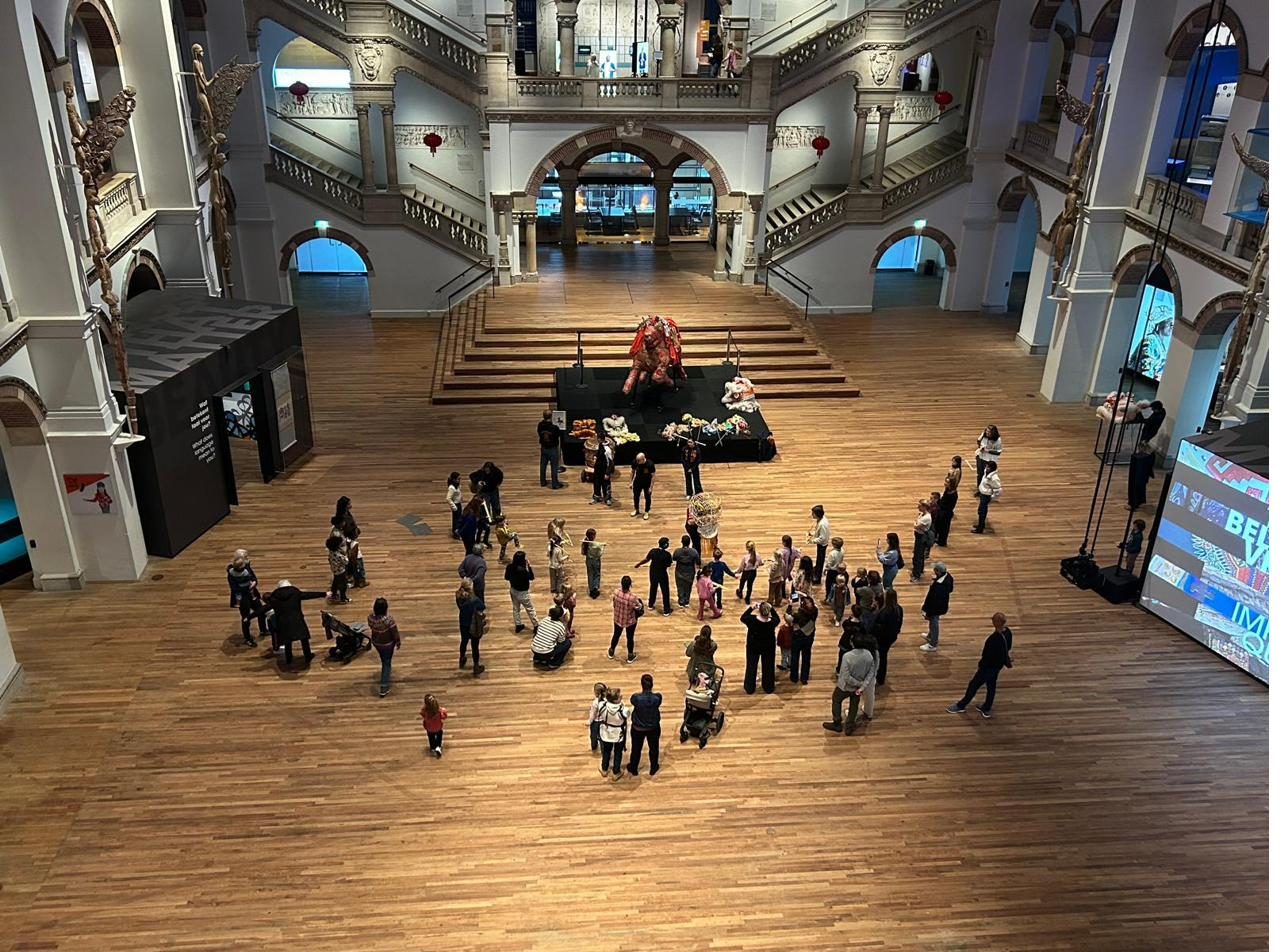
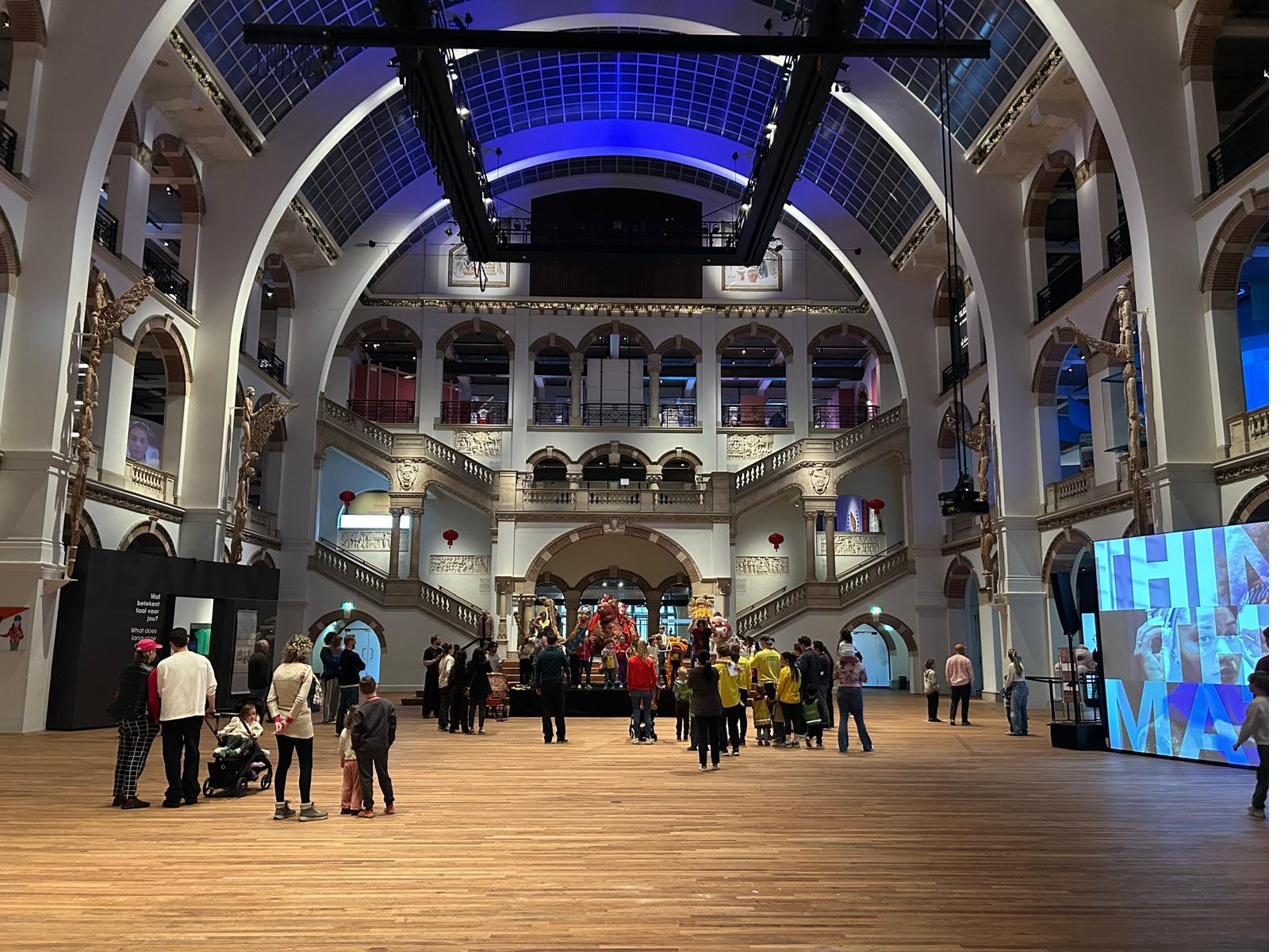
Where the Lion Head lived. Lion dance workshops on the stage, the installation off to the side.Man Lung’s lion dance in the grand hall. Our head is at the right edge of the stage.
The dance is the reason any of this happened, and watching it from the balcony with our head sitting quietly at the edge of the stage was the moment the whole thing made sense. One lion carried by two people who have trained for years. One lion on a table, watching the room, doing what it could.
The grand hall during the spring holiday week.Visitors working out what it responds to.
Two lions
At some point during the week a lion dance lion, carried by two performers, came across the floor to meet the one on the table.
When two lions meet in lion dance there is a way of doing it. They approach, they look each other over, they greet. It is part of the form, not decoration. What happens in this clip is that a trained performer extends that greeting to a machine.
What we took from it
Carmen was right that it was a good test case, though not in the way we expected. Nothing broke. The ABS held, the backups stayed in their box, the plug-and-play boot worked every morning. The engineering questions all got boring answers, which is the best outcome engineering questions can have.
What was not boring was watching people decide how to treat it. Almost nobody walked up and started issuing commands. They approached it the way you approach an animal, slowly, from the front, testing.
Monday 23 February, the first day on the floor.
Man Lung says a real lion dancer tells a story through small gestures: joy, sadness, mischief. We did not build that. We built something that recognises four movements and answers with three pairs of motors. But it was enough for people to meet it halfway, and that gap, between what it actually does and what people are willing to grant it, is the interesting part.
On problems, objectives, and the two steps that stand between them.
Notes towards a short book on research and design methodology, written for engineers. Three chapters so far, twenty-four diagrams, and a bibliography. It is a draft and it says so.
Exploring a problem until it can be stated, then turning the statement into a goal. The fishbone, the why-what model, and the stakeholder table that has to sit beside the diagram.
Nine sources, IEEE style, linked to the record or the full text.
Several diagrams respond to a click. The intervention cycle explains each stage, the why-what model switches between the blank model and a worked case, and the stakeholder quadrants give a worked example.
The Shape of a Research Project
1. The Problem Comes First
Every research project starts with a gap. There is a situation we want, and there is the situation we have. When the two do not match, we say we have a problem. That word is not a complaint. It is the engine of the whole exercise.
Research exists to produce knowledge, insight, and information that move us across that gap. The idea is not mine. It belongs to Verschuren and Doorewaard [1], and it holds whether the gap is practical or fundamental. A production line that keeps stopping is a problem. So is a phenomenon nobody has yet explained. In the first case we want a new situation. In the second we want to close a hole in what is known. The method for approaching them is the same.
Most beginners rush past this step. They pick a method they like, or a tool they already own, and then look for something to apply it to. That is backwards. The context defines the problem, the problem defines the goal, and only then does the machinery follow.
2. Two Steps
Designing a research project splits cleanly in two.
The first step is the conceptual design. It answers what, why, and how much. What are we going to do, why is it worth doing, and how far will we go.
The second step is the technical research design. It answers how, where, and when. How will we gather what we need, where does it come from, and on what schedule.
The order matters. A technical design built before the conceptual design is a set of activities without a destination. It will look busy and produce nothing.
Figure 1. The two steps. The first fixes the destination, the second fixes the route.
3. The Conceptual Design
3.1 The Objective
The objective is the goal of the project. It states what we want to achieve.
It is not invented at a desk. It is fed by everything gathered during the problem analysis, and it has to connect to what the stakeholders actually want. An objective that ignores the people who own the problem is a private hobby.
3.2 The Research Framework
Next to the objective sits the research framework. Think of it as the shape of the project drawn out: the phases, and how one phase feeds the next. It is a conceptualisation of the whole route from where we stand to where the objective says we should end up.
3.3 The Conceptual Model
Alongside the framework we put our ideas into conceptual maps. This is the conceptual model. It names the elements at play, and it makes the relations between them visible. Vague thinking survives in prose. It rarely survives a diagram.
3.4 Questions and Sub-Questions
The objective and the research framework together produce the research questions. In a design project, they are design questions. Either way, they are the operational form of the goal.
Each question breaks down into sub-questions. Answer the sub-questions and you answer the question. Answer the questions and you reach the objective. That chain has to hold, link by link, or the project drifts.
3.5 The Theoretical Framework
Now comes the part I will repeat more than once, because it decides the quality of everything else.
The questions have to be answered with proper tools and methods. Those tools do not appear by inspiration. They come from a theoretical framework: the literature, and the accumulated experience of engineers and researchers who worked on similar ground before us. The right literature inspires enough tools and methods to answer the sub-questions. The wrong literature, or too little of it, leaves the project with questions it has no way of closing.
Getting this to the expected level is not decoration on a report. It is the difference between a project that can be executed and one that cannot.
3.6 Define and Operationalise
Put the pieces together, objective, research framework, conceptual model, questions and sub-questions, and the project is defined and operationalised.
All of it grows out of observable phenomena. The context supplies the raw material. We do not design an objective in the abstract and then look for a world to fit it.
Figure 2. The conceptual design. Read it left to right: the goal, the phases, the questions. The theoretical framework enters from below, and it is where the tools come from.
4. Context, Aim, and Contribution
4.1 Where the Problem Sits
The project context is the answer to a blunt question: where exactly is this problem located, and who carries it.
The answer points at a target. Sometimes the target is an individual. Sometimes it is collective. Naming it early prevents a great deal of confusion later, because a problem carried by one operator and a problem carried by a whole plant are not the same problem, even when the symptoms look identical.
4.2 Two Kinds of Aim
From the target, the project takes one of two directions.
Under a theoretical framework, the aim is to extend existing views or to build new theories. You are closing a knowledge gap.
Under a practical framework, the aim is to solve a practical problem, to create a new situation, or to instigate new developments. In engineering this usually means an artefact. You design something, you build it, and the situation afterwards is different from the situation before.
Neither is superior. They are different destinations, and they demand different designs.
Figure 3. Context, target, aim. The same problem can be entered from either branch, but the two branches end somewhere different.
4.3 Contribution
Contribution is a word we will use again and again, so it is worth fixing its meaning now.
Open almost any scientific paper. Near the beginning there is a paragraph, often a whole section, where the authors state what is new here. Not what the field knows. What they added, and why this work stands apart from everything published before it. That paragraph is the contribution, and writing it honestly is harder than it looks.
Your project has the same obligation. A problem is usually extensive or complex, and a fundamental question worth asking is rarely one that yields all at once. Our project contributes to the solution only partially, and often only indirectly.
That is not a failure of ambition. It is an honest description of scope. Reach the objective, answer the questions, and you have contributed to the field. Claim to have solved the whole problem and you are either working on something trivial or being dishonest about your boundaries.
Figure 4. Scope. The bracket is the honest claim; the arrow is what a single project actually delivers.
5. Types of Projects
5.1 Theory-Oriented Research
Theory-oriented work splits into two branches [1].
Theory development targets gaps in the construction of a theory.
Example: a gap closed
Through the 1960s, 70s, and 80s, string theory, the attempt to explain fundamental particles and matter as strings, drew enormous attention. By the early 1990s there were five competing versions of it. Five points of view on the same subject, and no way to reconcile them.
Then Edward Witten proposed a mathematical framework showing that the five were not rivals at all. They were variations of one general theory, seen from different sides. That is a gap in the construction of a theory, and closing it is theory development.
Theory testing sets out to test, adjust, or refine existing views. You are not building the theory again. You are finding out whether it holds.
Example: a theorem put under load
You can work out on paper how a robot will move faster and track a trajectory more accurately. You can prove a theorem and claim the performance will be stable.
Then you have to test it. First in simulation, where you see whether the theorem behaves as the paper says. Then, if you are serious, on the physical robot, which is harder, because now you need real parameters from a real machine and the world stops being cooperative.
The textbook was written with the social sciences in mind. This is my reading of it for control, robotics, and process engineering, and the logic survives the translation intact.
5.2 The Empirical Cycle and the Scientific Method
Two well-known routes serve both branches. The empirical cycle, from van Aken, Berends and van der Bij [2], starts with the choice of a phenomenon worth studying. Design the research, observe, induce toward theory, deduce hypotheses, test, evaluate, and return to the design.
The scientific method is the same animal under a different name. Make observations, ask why the pattern occurs, formulate hypotheses, develop testable predictions, gather data. Then comes the part people forget: a smaller loop inside the large one, where hypotheses are refined, altered, expanded, or rejected, and the data is gathered again. Only after that loop settles do you reach for a general theory.
Look closely at both and you will find the same logic proposed by different authors. Both are cycles. Neither ends. That is the point.
Figure 5. The empirical cycle, with the inner loop that most descriptions leave out. Hypotheses rarely survive their first contact with data.
5.3 Practice-Oriented Research
The problem solving cycle[2] begins with a problem mess: a practical situation, an engineering situation, that nobody has yet stated clearly. Defining it is the first task, and you cannot define what you do not understand.
Understanding is an active step, not a reading exercise. Can you reproduce the problem in a simulation environment? Can you go to the process, change a parameter, and watch the fault appear on demand? If you can make the problem happen when you choose, you understand it. If you cannot, you are still guessing.
From there: problem definition, analysis and diagnosis, a plan of action, the intervention, and the evaluation of results. Solving one problem creates new ones. That is how the cycle closes.
The intervention cycle[1] covers the same ground in five steps: problem analysis, diagnosis, design, change, evaluation. Compare the two and they are close relatives. The word that carries the difference is change, because change means something in the world now behaves differently. The process runs at a new operating point. The robot is faster. The artefact meets your specifications, or it does not, and the gap between what you specified and what you obtained is exactly what evaluation is for.
The intervention cycle comes out of the social sciences. I have introduced it here so that it also carries engineering problems and fundamental questions, and in my experience it carries them well.
Select a stage
Each stage has to settle something before the cycle is allowed to turn. Choose one on the diagram.
Figure 6. The intervention cycle. Five steps, and a sixth truth: the evaluation is where the next problem announces itself.
6. Naming a Cycle Is Not Enough
Here is the mistake I see most often, and it is worth a section of its own.
Asked what method they will use, students answer that their work follows the problem solving cycle, or the empirical cycle. Fine. That is true, and it is the right thing to state in a proposal. It is also nowhere near enough. A cycle is the general framework at the beginning of a project. It tells the reader almost nothing about what you are actually going to do on Tuesday.
Go to the literature and come back with tools and methods that real researchers have demonstrated on problems like yours.
Say you will model the process in Aspen and test scenarios for capturing carbon dioxide, because that is current technology and the software is built for it. Or say you will simulate the chemical process in MATLAB, because a specific author argues that route is better suited, or simply because you have the licence and the models exist. In operations research, name the linear programming formulation. In control engineering, decide whether the problem calls for linear or nonlinear control, and say what kind of mathematical model sits underneath.
The same applies on the theory side. If you are making observations, explain what makes those observations observable. If you are gathering data, say what data, and whether you will generate it, collect it, or simulate it. Say how you will validate an observation before you claim to have understood anything.
Cycles tell the reader what kind of project this is. Methods and tools tell the reader you can finish it.
Figure 7. Three levels of specificity. A proposal that names only the top level has described a genre, not a plan.
7. The Technical Research Design
7.1 Research Strategy
Strategy forces three decisions. Depth or wide range. How much data. What type of data, and how complex and available it is.
Choosing depth and breadth at the same time is the most common way to run out of time.
7.2 Research Material
Material means the research population: people, objects, situations, documents. It also means the gathering techniques, the methods and the tools. Simulation, pilot studies, experimental design, prototyping, rapid prototyping.
This is not a checklist to tick. The choice should be inspired by real projects, real problems that were already solved, and real questions that were already answered in part or in full. Somebody has done something close to this before. Find them.
7.3 Research Plan
The plan is the time schedule. Deadlines for the products and the deliverables, reporting included. A Gantt chart does the job well.
Build it once, properly, and you will keep using it. Not only for a research project, but every time you face a complex situation with a deadline attached. That skill outlives any single project.
Figure 8. The technical research design. Three decisions, in this order. The plan is last because it cannot be written until the first two are settled.
8. A Closing Note
None of this is bureaucracy. The structure exists because complex problems defeat people who improvise. Define the problem, state the goal, map the phases, ask answerable questions, borrow the right tools, then plan the work.
And remember what the diagrams in this chapter keep telling you. They are cycles. Solve a problem and new problems arrive. Answer a fundamental question and new questions arrive with it. That is not a sign the work failed. It is the work continuing, and the only real preparation is knowing it is coming.
The Problem and the Objective
The first chapter said that the objective is the goal of the project and that it is fed by the problem analysis. This chapter is that analysis. It covers the diagnosis, the tools that make a diagnosis possible, the problem statement that closes it, and the two ways of turning a statement into a goal.
1. Two Steps to an Objective
Formulating an objective takes two steps, and they run in order.
Exploration comes first. What problems are involved, and how complex are they. What is the background, which is to say the context. What do the stakeholders want, in their own words, before anyone translates it.
Formulation comes second. Now the researcher positions the work in time and in space. Is it realistic. Is it adequate. And a question people leave far too late: once the objective is achieved, how will anyone measure that it was.
Reverse the order and you get an objective that sounds impressive and rests on nothing.
Figure 9. The two steps to an objective. Exploration gathers the ingredients; formulation commits to a goal.
2. Exploration
2.1 What You Explore Depends on the Kind of Project
Exploration sets the problem context, and how you do it follows from the type of research.
Theory-oriented work runs on extensive literature research. You find the current subjects of discussion in the field, and from those you find the directions in which solutions might lie.
Practice-oriented work starts from a problematic situation, and you reach for a technique: the why-what model, the five whys, the five questions, a fishbone diagram, a stakeholder analysis. We will take three of these apart later in the chapter.
Note what does not change. Both branches demand serious reading. The literature is not a decoration on practical work.
Figure 10. Two routes through exploration. The techniques on the lower branch are interchangeable; the reading on the upper branch is not optional on either.
2.2 Why Solutions Fail
Watch enough projects and the failures start to rhyme. People do not fail because the problem was impossible. They fail for reasons that were visible from the start.
Some are not methodical. Some lack the commitment to see it through. Some misread the problem statement, usually because the diagnosis behind it was never done. Some lack knowledge of the techniques and processes involved, which means they needed to learn something before they began and did not. Some pick a method that has nothing to do with the problem in front of them, which is again a diagnosis failure. And some work from information that is insufficient or inaccurate, with no analytical thinking applied to it.
One thing addresses most of that list. Formulate the problem properly. To formulate it you need information, to gather information you need tools of diagnosis, and those tools have to fit the context of the problem.
Figure 11. Seven ways to fail, and the one piece of work that heads off most of them.
2.3 The Problem Statement
A problem statement is a concise description of the issues that have to be addressed before anyone tries to solve anything. One or two paragraphs. It is the capitalisation of the whole exploration phase, and it has to be connected to the context.
Its purpose is to focus attention. Not only the attention of the problem owner, but of whoever will execute the work, whether that is one person or a team.
An ill-defined problem is a signal, not a misfortune. It means the elements of the problem context have not all been gathered yet. Go back and gather them.
3. Read, Discuss, Report, Repeat
This is the mantra, and it is the whole working method of the exploration phase.
Read a great deal. Key journal papers, textbooks, patents, official reports from the company, the organisation, the university. Build a draft bibliography as you go. And let that bibliography show up throughout the document, not only in the introduction. It belongs in the diagnosis, in the statement of the goal, in the choice of methods and tools, and in how you define your deliverable and validate it.
Discuss once you have enough background to ask decent questions. Stakeholders first, for their desires. Daily supervisors, academic advisors, experts in the field.
Report, because this is what makes the difference. Weekly reports, the problem analysis, the project report, the presentation. These are official channels and they have to be written. Findings that stay in your head are not findings. Decide the outline of the story: diagnosis first, then the tools that produced it, then the goal, the questions, the methods.
Then repeat. One pass through this loop is never enough.
A word on order, because this is the most common mistake I see. If your stakeholder analysis appears after your problem statement, something has gone wrong. The analysis is one of the things that produced the statement. It cannot arrive afterwards to justify it.
Figure 12. The exploration loop. The arrow back from reporting is the one people skip, and skipping it is why a second pass never happens.
4. Three Tools
4.1 The Fishbone Diagram
The fishbone identifies possible causes for an effect or a problem. It belongs immediately after the interviews, the reading, and the brainstorming, and its job is to give all those loose causes a structure.
The classic version uses five categories: man, tools, environment, method, information. Do not treat that as fixed. One published study of obstacles to plastic recovery organised its bones around legislation, cost and capacity, technology, quality and demand, and market share. A study of storage tank accidents used eight. The categories come from the problem, not from the template.
One warning. The diagram does not license a guess. If you put a cause on a bone, expect to be asked where it came from. The literature, or the interview with the informant, the specialist, the problem owner. A fishbone full of unsourced assumptions is a drawing, not an analysis.
Figure 13. The skeleton, with the five classic categories. Replace them with categories that suit your problem, and hang one sourced cause on each stub.
4.2 The Why-What Model
The why-what model, proposed by Annamalai and colleagues [3], takes a rough first description of the problem and pushes it in two directions at once.
Upward it asks why do we want to solve this. That opens the broader problem, the context that makes the work worth funding.
Downward it asks what is stopping us from solving it. That opens the narrower problem, and this is where the technicalities live. Keep going down and you usually arrive somewhere very specific, which is exactly where a project can get a grip.
The model sits happily alongside a fishbone or the five whys. Use whichever combination makes the problem yield.
Figure 14. The why-what model. The worked case follows a laser system that could not meet its product requirements consistently. Draw your own version before you look at it.
4.3 Stakeholder Analysis
Stakeholders are the people with a stake in the project, through interest, through power, or through both. The analysis has two halves, and most people do only one of them.
The first half is positioning. For that we use Mendelow's diagram as presented by Ackermann and Eden [4]: interest on one axis, power on the other, four kinds of stakeholder in the quadrants. It tells you whose attention you must hold, whose you only need to keep, and whose absence from the room is survivable.
Select a quadrant
Each quadrant asks for different handling. Choose one to see it worked through on a production line bottleneck.
Figure 15. Mendelow's diagram. Position is not a property of a person; it is a property of a person and a particular project.
4.4 The Table Next to the Diagram
The diagram is the half everyone remembers. The table is the half that does the work, and it belongs on the page directly beside it. One without the other is not a stakeholder analysis.
Five columns. A number, so that the rest of the project has something to refer to. A name, and it has to be a real person rather than a role in the abstract, because roles do not hold opinions and people do. The function that person holds in the organisation. What that person wants, in their own words. And the technical requirement you derived from those words.
The fourth column is why you conduct interviews. Prepare your questions in advance, go and sit with the person, and write down what they say rather than what you expected to hear. You will get three kinds of answer. A few people hand you a technical requirement outright, already in numbers, and those people are a gift. Most hand you a wish. Some hand you a demand, or an anxiety, which is a wish with the temperature raised. Neither of the last two is SMART, and neither can be designed against.
Turning the fourth column into the fifth is the designer's work, and it is not a formality. It is where a vague sentence becomes a quantity a machine can be measured against, and it has to be written down. A requirement that lives only in your memory of the conversation is not a requirement.
No.
Name
Function
Desire, in their words
Technical requirement
S1
Anneke Bakker
Production manager
the line stops two or three times a shift and I lose most of a shift every week
Unplanned downtime below 2 per cent of scheduled shift time, measured over four consecutive weeks
S2
Rutger de Boer
Managing director
it has to pay for itself before the next budget round
Payback within 18 months at current production volumes
S3
Ilse Veenstra
Maintenance manager
whatever you put in, I do not want to be called out at night for it
Mean time to repair under 30 minutes, using no tooling beyond the standard set
S4
Marek Nowak
Shift lead, packaging
the operators should be able to clear a jam themselves
One operator clears a jam in under 3 minutes without removing a fixed guard
Not from the literature
You will not find this table in the sources behind this chapter. Mendelow's grid is well documented, and the move from desires to specifications is discussed in places, but the table as I am describing it, numbered, named, and carried through the whole project, comes from practice rather than from a paper.
I include it because in the projects I have seen it is the difference between a stakeholder analysis that shaped the work and one that was written afterwards to decorate it.
Now the part that is usually missed. During exploration the table helps you understand the problem, the system, and the requirements. That much is obvious enough. But the table does not stop working when exploration ends.
Once the objective is written, once the milestones are set, once the methods and tools are chosen, each of those decisions should trace back to a numbered row. The objective serves S1 and S2. This milestone exists because of S3. That tool was chosen because S4 needs an operator to clear a jam unaided. Run the trace and two useful things fall out. A decision that traces back to nothing is a decision you made for your own convenience. A row that nothing traces back to is a person you interviewed and then ignored, and they will notice.
Figure 16. Traceability. The tags above each box name the rows that choice serves. A box with no tag above it is a choice nobody asked for.
5. Formulation
5.1 Five Qualities
The textbook offers five tests for an objective [1]. It should be useful, which is to ask where the relevance lies and what the contribution will be. Realistic, which asks whether the system is well scoped or whether you have quietly taken on a larger one. Feasible, which asks whether you have the expertise, whether you need to learn new techniques first, and whether you can actually get at the data. Clear, which asks for precise language. And informative, which asks what new insight or knowledge the objective promises.
5.2 SMART
The second tool is SMART, proposed by Doran [5] and later refined by Bjerke and Renger [6].
Specific: aimed at one area of interest, or at a defined connection between areas. Given a large system, scope down to a subsystem.
Measurable: this is where the stakeholder analysis pays off, because you have already moved from vague desires to specifications that can be measured, and those specifications can go straight into the objective.
Attainable: reachable with the resources you actually have.
Relevant: with a clear contribution, whether that is insight, knowledge, or an artefact that solved the problem.
Time-bound: a reference date and a timeline, connected to the plan of the project.
5.3 The Two-Step Method
SMART is not a set of boxes to tick, and neither are the five qualities. Be smart about using it.
Bjerke and Renger [6] propose taking it in two steps, and the reason is worth understanding. Specific, measurable, and relevant all come directly out of the problem analysis and the problem statement. If you did that work, the information is already there. Attainable and time-bound are different in kind. They are negotiable, and more uncertain, because they depend on resources and on a schedule that has not been tested yet.
So settle the first three and write them down. Only then argue about what is attainable and by when. Trying to satisfy all five at once is how people end up with an objective that is precise about its deadline and vague about its purpose.
Figure 17. SMART taken in two steps. The crossing lines are the point: the letters are not in the order you should use them.
With a stated problem and a formulated objective, the ground is prepared. What follows is the work of turning that objective into research questions, laying out the research framework, and defining the concepts precisely enough that other people can use them.
Thinking in Systems
A confession about the order of this book. You have just read a chapter on analysing a problem and formulating an objective, and you are about to read a chapter about systems. In practice the sequence runs the other way. The system description belongs in the problem analysis, before the problem statement is written, because you cannot describe a problem without describing the thing the problem is happening inside. The last figure in this chapter shows where it really sits.
I have given it a chapter of its own for a simple reason. This is not one more technique to add to the fishbone and the why-what model. It sits underneath them. A system description can be what a fishbone is a fishbone of. It is a way of seeing, and it takes longer to explain than a tool does.
1. Why Talk About Systems At All
Systems analysis is largely a craft. Skilled people draw on the knowledge and the tools of many sciences and technologies to build something that answers to the needs of whoever will eventually use it [7]. That word, craft, is the honest one. It is not a procedure you execute.
More formally, systems analysis uses scientific methods to examine and structure complex systems inside a particular domain. It aims at an approach that is open, empirically grounded, and checkable by someone else, while accepting that complete certainty is not available [8].
Four things recommend the systems language.
It corrects for reductionism. Our models are always some distance from reality, and the complexity of the actors involved is rarely captured by taking the thing apart. Holism pulls in the other direction.
It attends to structure as well as process. You are not following a blueprint. Difficult problems deserve an approach chosen for them.
It is transdisciplinary. Electronics, mechanics, process engineering, industrial design, all brought to one problem so that the design that comes out of it is whole rather than partial.
And it gets closer to real problems. Models built this way sit nearer to the situation they describe.
The advantage is that a systems approach brings structure to problems that are complex and ill-defined. It forces you to state your assumptions and your expectations out loud, it gives you something to communicate with stakeholders about, and it comes with a large set of tools for building models of a domain. It will not hand you a definitive solution. It will let you eliminate the unfavourable alternatives, which is often the more useful service.
The limitation is incompleteness, and it is inherent rather than a sign of sloppy work. Practical constraints bite, not every factor can be considered, and decisions with long horizons and many actors add uncertainty that no diagram removes. Say so in your report rather than hoping nobody notices.
2. The System Diagram
The basic picture is a block with a boundary drawn around it. Inside are the internal factors, the things you are treating as part of the system. Entering from the left are the means, the levers you can actually pull. Leaving on the right are the criteria, the things you will measure. Coming down from above are the external factors, which influence the system and which you do not control [8].
The moment that diagram is filled in, a great deal becomes visible at once: what the problem is, what the objectives are, and what influences what.
Figure 18. The system diagram. What you can change enters on the left, what you will measure leaves on the right, and what you must live with comes down from above.
2.1 Four Words, Used Precisely
The diagram only works if these four are kept apart [8].
Interests
The values and desires an actor gives priority to.
Objectives
Those interests made situation-specific, concrete, and defined.
Criteria
The measurable factors derived from objectives that are otherwise abstract.
Means
The actions available to achieve a specific objective.
Notice that this is the same movement as the stakeholder table in the previous chapter. Interests are what people tell you in the interview. Criteria are what you wrote in the fifth column. The system diagram is where those criteria finally have somewhere to attach.
2.2 Building One
Four steps [8]. Set the initial problem demarcation and the level of analysis. Specify the objectives and the criteria. Identify the potential means, and map the main causal relations among the internal factors and their influence on the criteria. Then draw the diagram that gives an overview of the whole problem situation.
The first step is a means-ends analysis, and the rule of thumb is to start from the core desires of whoever owns the problem rather than from the first solution anyone proposed. The level at which you analyse the problem quietly determines which solutions are even thinkable.
The second step usually produces an objectives tree: a core objective at the top, and beneath it the two or three more specific things that would have to be true for it to hold. Good use of a metro line, for instance, resolves into many passengers, low operating loss, and low crowding, and those are things you can measure.
The third step is causal mapping, and it is messy the first time. Draw the factors, draw arrows between them, mark each arrow with a plus or a minus. The first attempt looks like a bird's nest. Then you find the loops, you find the factors nothing connects to, and you tidy it into something that will fit inside the boundary of your diagram.
3. The Scope, and Why It Is the Whole Point
A system almost never stays one system. Draw a hydrogen distribution line as compressors and buffers feeding a fuelling station, and it is a system. Look closer at that station and it contains heat exchangers, chillers, separators, purification. The station was a box; now it is a system of systems.
Which means the diagram has to say where you stop. Draw the subsystems, draw the interrelations, then mark the scope: the part of the system this project will actually touch.
Figure 19. Subsystems, and the scope drawn on top of them. Everything outside the red line is context you describe and do not change.
Why the scope is worth the effort
Once the scope is drawn on the block diagram, or the electrical diagram, or the flow diagram, three things that were floating separately lock together. The measurable objective. The technical requirements from the stakeholder table. And the boundary of what you are actually going to touch.
That is what makes an objective realistic and time-bound rather than merely worded that way. S1 says downtime below two per cent; the scope says you are working on subsystem S2; the objective says what S2 has to do for that number to be reached. Take away the diagram and the objective is a sentence with numbers in it. With the diagram, it is bounded, and you can defend it.
4. Hard and Soft
Not every problem calls for the same systems approach, and Jackson gives a way of telling which one you are in [9]. Two questions. How similar are the participants, and how complex is the system.
Participants means everyone with a stake, not only the researcher: the people with high interest, the people who set technical requirements. Judge them on three things, values, beliefs, and interests. Where those largely coincide, the participants are unitary. Where they do not, the context is pluralist, and the comfortable assumption that there is one agreed goal has to be abandoned.
Combine that with the complexity of the system and you get a grid.
Figure 20. Systems approaches against problem contexts. Locate your project here before you choose a method, not after.
Example: a project in the top left
Take a study of the thalamus acting as a controller for regions of the brain. There is one point of view in the room: control theory, mathematical modelling, numerical analysis. The participants are academics who broadly agree on what counts as an answer. One system is in play, and in the end one nonlinear model of it. No other engineering field is involved.
Unitary participants, a system that is not extremely complex. Hard systems thinking, and the methods follow from that.
Change one thing, put organisational systems or complexity theory into it, or bring in actors who disagree about what the problem even is, and the project moves out of that cell. The methods have to move with it.
5. The Systems Analysis Methodology
Jackson also sets out a methodology in three stages [9], and you will recognise the shape of it from the first chapter.
Formulation. Formulate the problem, and out of that come three things: the values and criteria of the participants, the objectives, and the boundaries and constraints.
Research. Identify, design and screen the alternatives. Then build and use models to predict the consequences of each, informed by some forecast of the contexts those alternatives will have to survive. This is where you generate or gather data, build a numerical model, and check whether it says anything true about the world.
Evaluation and presentation. Compare and rank the alternatives, communicate the results, evaluate the analysis itself, and then decide and implement. Afterwards, evaluate the outcome, which is not the same thing as evaluating the analysis.
Formulation, research, evaluation. Set that beside the empirical cycle and the intervention cycle and you are looking at the same skeleton in different clothes.
Figure 21. Three stages. The last box hides a distinction worth keeping: evaluating the analysis and evaluating the outcome are separate acts.
6. Choosing a Model
Once you know what your system is, two questions decide what kind of model can represent it. Are the variables deterministic, predictable from the laws of nature, or are they stochastic? And does the system depend on time?
Those two questions give four answers [9]. Deterministic and steady state gives you algebraic equations. Deterministic and dynamic gives you differential equations, linear or nonlinear. Non-deterministic and steady state gives you statistical and probability relationships. Non-deterministic and dynamic gives you discrete-event simulation, and there is a third question hiding in that cell: whether time is continuous or discrete.
Figure 22. Four kinds of analytic model. Ask which cell you are in before you choose a toolbox, not after you have already learned one.
7. Defining Concepts
One step remains before the technical design, and it is easy to postpone. Define your core concepts.
The temptation is to leave it until the research is under way. The reason not to is that the significance you attach to a key concept determines what material you will need to gather, and unexpected phenomena have a habit of arriving once the work has started [1].
These are stipulative definitions, which means they cannot be correct or incorrect. They can only differ from other definitions. What they can be is useful, and a definition earns its place by contributing to the objective. Three tests. Does it delineate, marking off what is inside the concept and what is not. Is it observable, which is to say operationalised into indicators, and those indicators are often precisely the technical requirements that came out of your stakeholder analysis. And does it link up to the research objective and the research questions, with enough feasibility that the answers can actually be obtained.
This is also why the objective has to be SMART. A concept defined into measurable indicators is what makes the measurable part possible at all.
From there we reach conceptual modelling: a set of assumed causal relationships between the core concepts of a project. A conceptual model is one of three things, or some combination. It can be descriptive, showing relationships between the objects, variables and entities of a system. It can be causal, showing only what drives what. And it is always an abstraction, a simplification of reality. Every model is wrong. The work is to be rigorously less wrong than the alternatives.
When you draw those causal relations, a handful of patterns cover most of what you need.
Figure 23. Five patterns of causal relationship. Most causal maps are these five, repeated.
8. Where All of This Sits
Here is the map, and it answers the question this chapter opened with.
Read it and you can see that the system description is not an appendix to the problem analysis. It sits inside it, next to the stakeholder analysis, and both of them come before the problem statement. The scope hangs off the research objective, because the scope is what makes that objective bounded. Defining concepts is the last thing you do while still in the conceptual design, and only then does the technical research design begin.
We cannot talk about the problem without the system, and if we are talking about a system it is because there is a problem. The chapter order in this book is a convenience. The map is the truth.
Figure 24. The conceptual design, in the order it is actually done. Everything inside the dashed line happens before a single decision about method or schedule.
References
Numbered in order of first appearance, in IEEE style. Titles link to the catalogue record or to the full text, and each entry carries a DOI where one exists; the two items without one predate the system. Software named in the text, such as process simulators and numerical computing environments, is not listed here.
[1]P. Verschuren and H. Doorewaard, Designing a Research Project, 2nd ed. The Hague, The Netherlands: Eleven International Publishing, 2010, ISBN 978-90-5931-572-3.
[7]W. Findeisen and E. S. Quade, “The methodology of systems analysis: An introduction and overview,” in Handbook of Systems Analysis: Overview of Uses, Procedures, Applications, and Practice, 1985, pp. 117–150.
An illustration, not a document. The paper on the desk is imaginary and so are the reviewer marks on it; the real ones are named below.
C. S. Lewis had a rule about reading. After a new book, do not allow yourself the next new one until you have read an old one in between. If one for one felt too strict he offered a fallback, one old book for every three new ones. The argument was not nostalgia. Every age is good at seeing certain truths and prone to certain mistakes, so the books that can correct our own period are the ones written outside it.
The line travels today in a shorter form, usually credited to Ivan Pavlov by accounts that never give a source. I have looked for one. Descartes made the same case three centuries before Lewis, describing good books as a conversation with the best minds of past centuries. The thought is old enough that ownership is the wrong question.
What nobody seems to have written is the version our trade needs. We do not read books. We read papers, and mostly recent ones, because that is what the field rewards. So here it is in our dialect.
If you want a new idea, read an old paper.
Below is what that cost me and what it bought.
The paper trail
In November 2023, three co-authors and I submitted a force-impedance controller in the port-Hamiltonian framework to IEEE Transactions on Control Systems Technology. We validated it on the Philips Experimental Robot Arm and compared it against the parallel force and position controller of Chiaverini and Sciavicco, published in 1993.
Five months later the decision came back. Reject, may be resubmitted.
“The most important drawback of the study is that an approach that is more than 30 years old was used as a baseline comparison. Although many other works built upon that baseline approach for 3 decades were briefly cited in the manuscript, it is odd to see that the comparison is still made over a 3-decade-old approach.”
Reviewer 7, on version 1, 27 April 2024
“Why are you comparing with literature from 1993 and 1994? Why not with more recent literature?”
Reviewer 4, same day
The associate editor agreed with both of them, and said the comparison diminished the effectiveness of our claims.
We spent the spring rewriting. New introduction, recent surveys, the energy-tank and geometric-impedance results, the learning-based adaptive work of the past decade. We did not change the benchmark. Our reply said why.
“While there have been many recent advances in the field of robotic arm control, many of these approaches still rely on underlying principles and methods similar to those proposed in earlier works.”
Our rebuttal letter, June 2024
Author #4 put it better in an email that month.
“I totally agree that the old papers are fundamental and this was the reason why they have been extensively cited in the first version. However, a more recent literature review was missing, but now everything looks ok.”
Author #4, 25 June 2024
We resubmitted in July. In January 2025 the paper was conditionally accepted, and the objection came back in capital letters.
“In the current version, although some more recent works were briefly cited, it is STILL odd to see that the experimental comparison is made over a 3-decade-old approach.”
Reviewer 1, on the second version, 8 January 2025
The associate editor quoted our own rebuttal sentence back at us, said the comparison remained limited in scope, and closed with a warning that rejection might still follow. I wrote to the other three the next morning.
“I see that, indeed, there is an issue we need to address again regarding comparing our approach to significantly older ones. But anyway, we still consider that this is a fair comparison.”
My email to the three co-authors, 9 January 2025
We submitted the last version in April 2025. The report that came back in August was one sentence long: the authors replied to all reviewer concerns. Accept without changes. The 1993 controller was still the comparison.
“Perseverance pays off, great!”
Author #3, 9 August 2025
“The concepts we developed continue to guide my current work on impedance control for humanoid robots.”
Author #1, two days later
The honest part
We did not win by refusing to read new work. We won by adding it. Between the first submission and the last, the paper gained a current literature review, a simulation study, a sampling rate, a wiring description, a public repository, a better video, and captions that explain why the arm stops short of the commanded position when it is pressing on a bar. All of that came from the reviewers, and all of it made the paper better.
One thing did not change. The controller we measured ourselves against was still the one from 1993.
Recent work told us where we stood. The old work told us what to beat.
That distinction is the part worth keeping. A literature review and a benchmark do different jobs. A review places you in a conversation, so it has to be current or it is simply wrong. A benchmark has to be the thing people still measure against, and that is a property time confers, not novelty. The reviewer who wrote that many other works had built on the 1993 approach for three decades was, without meaning to, making our case.
There is a failure mode on the other side and it deserves naming. Choosing an old method because it is easy to beat is not scholarship, it is theatre. The test is whether the old method is still the reference point people reach for. If it is, the comparison is fair. If it is not, you are shadow boxing. We argued it was, in writing, three times, and eventually an editor and three reviewers agreed.
So, the rule I would actually give a student. For every three conference papers you read, read one journal paper older than you are. Not out of reverence. The field’s blind spots are shared by everything published this year, including your own manuscript, and the only literature guaranteed not to have them is the literature written before they formed.
Ours is an age that is good at seeing what is new and liable to mistake recency for progress. The correction is cheap. It occasionally costs you two rounds of argument with a reviewer who thinks a date is an argument.